Query Athena using Jupyter
Use a notebook to analyze your Athena data

Jean-Christophe BaeyNovember 24, 2021

Photo by Tom Parkes on Unsplash
TL;DR;
AWS Athena is a powerful tool for analysis S3 JSON data coming from AWS Kinesis Firehose.
The console interface is great for a quick query but when you need to run analysis for several hours, Jupyter is a better way.
This article will give you the first steps to run Athena queries inside a Jupyter notebook.
Local installation
Install Jupyter lab
$ brew update && brew upgrade python
$ brew reinstall pipenv- in a dedicated folder:
$ mkdir jupyter && cd "$_"
$ pipenv --python 3
then :
$ pipenv shell
$ pip install jupyterlab
$ pip install --upgrade pandas- Install plotly for charting (optional)
$ pip install plotly
$ jupyter labextension install @jupyter-widgets/jupyterlab-manager jupyterlab-plotly- Run Jupyter lab:
$ jupyter labInstall Aws Data Wrangler
- Refer to the official documentation on Github
$ pip install pyarrow awswrangler(make sure you are using python 3.9+, in case of failure, follow this guide)
Usage
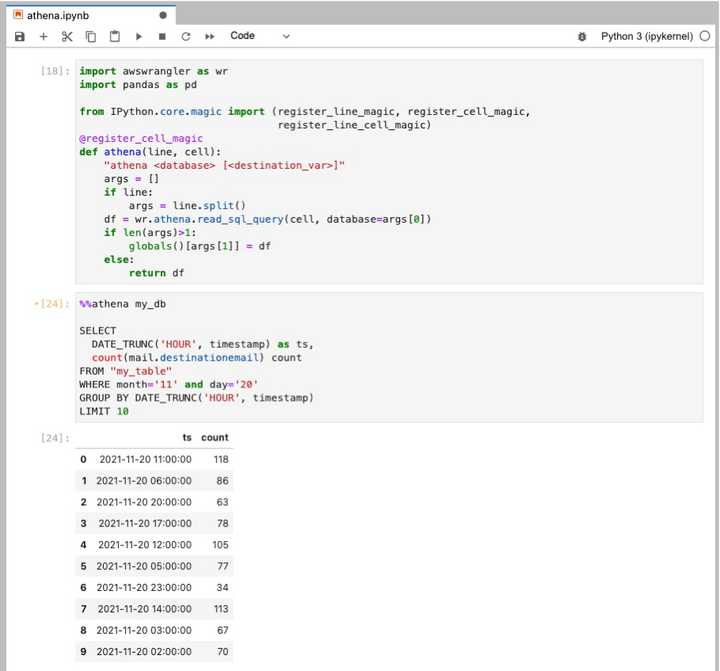
- Import the lib and register the magic keyword
athena
import awswrangler as wr
import pandas as pd

from IPython.core.magic import (register_line_magic, register_cell_magic,
                                register_line_cell_magic)
@register_cell_magic
def athena(line, cell):
    "athena <database> [<destination_var>]"
    args = []
    if line:
        args = line.split()
    df = wr.athena.read_sql_query(cell, database=args[0])
    if len(args)>1:
        globals()[args[1]] = df
    else:
        return df
- To repair a table, this is the equivalent to
MSCK REPAIR TABLE my_table;
query_final_state = wr.athena.repair_table(table='my_table', database='my_db')
print(query_final_state)- To query and get a panda df
df = wr.athena.read_sql_query('SELECT DATE_TRUNC(\'HOUR\', timestamp) as ts, mail.destinationemail as email FROM "my_table" WHERE month=\'11\' and day=\'24\' LIMIT 10', database="my_db")
df- To query using the magic keyword
%%athena my_db

SELECT
  DATE_TRUNC('HOUR', timestamp) as ts,
  count(mail.destinationemail) count
FROM "my_table"
WHERE month='11' and day='20'
GROUP BY DATE_TRUNC('HOUR', timestamp)
LIMIT 10 - To query using the magic keyword and store the result in a variable
%%athena my_db myDf

SELECT
  DATE_TRUNC('HOUR', timestamp) as ts,
  mail.destinationemail as email
FROM "my_table"
WHERE month=\'11\' and day=\'24\'
LIMIT 10- To plot the result
import plotly.io as pio
import plotly.offline as py
import plotly.graph_objs as go
import plotly.figure_factory as ff

pio.renderers.default='notebook'
py.init_notebook_mode()

plots = []

sent_emails_pd = sent_emails.reset_index().set_index('ts')
plots.append(go.Scatter(x=sent_emails_pd.index, y=sent_emails_pd["count"], name="Sent"))

opened_emails_pd = opened_emails.reset_index().set_index('ts')
plots.append(go.Scatter(x=opened_emails_pd.index, y=opened_emails_pd["count"], name="Opened"))

click_emails_pd = click_emails.reset_index().set_index('ts')
plots.append(go.Scatter(x=click_emails_pd.index, y=click_emails_pd["count"], name="Clicked"))

# Plot
py.iplot(plots, filename='jupyter-basic_bar')
👉 Don't forget to follow me on Twitter to be notified when new posts are available!

